
 TapToConnect
Creating a PDF report
A neat report for your client or your manager, with your own logo.
▶Watch the video: analyticsWith captions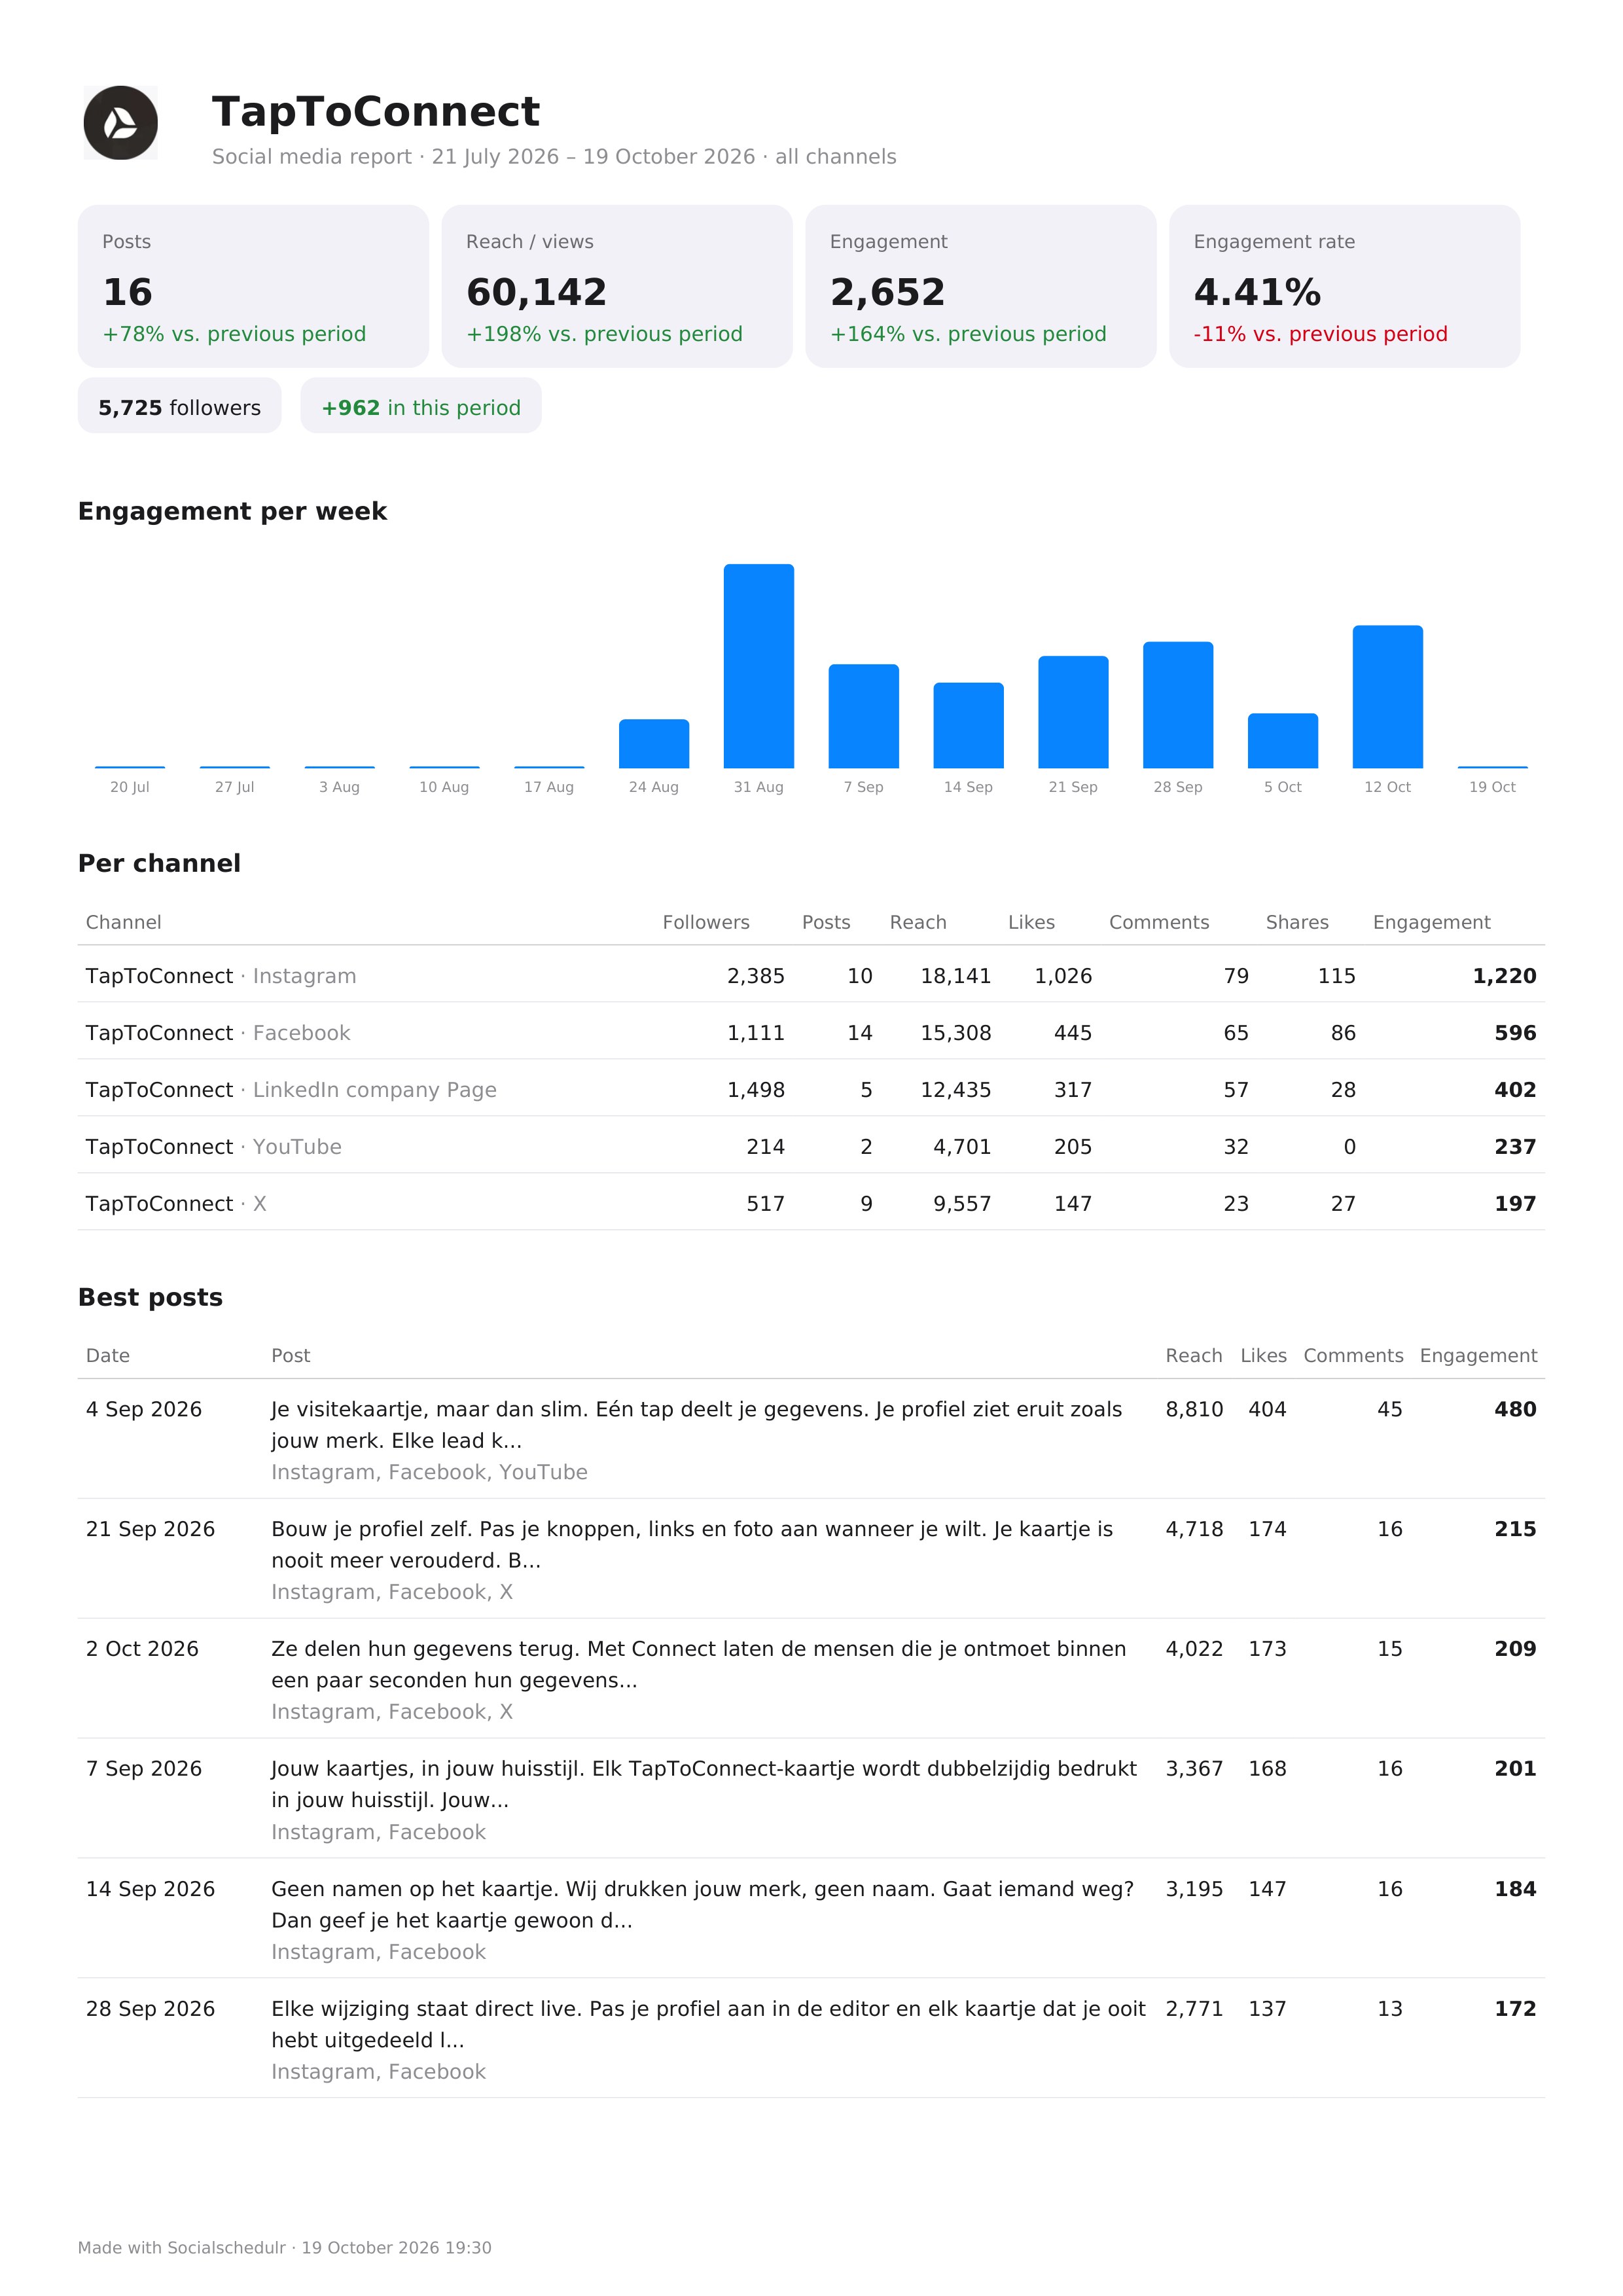
- Go to Analytics.
- Choose the period (7, 30 or 90 days or a year) and optionally one channel.
- Click Report (PDF).
The report contains:
- the key figures: posts, reach, engagement and engagement rate, compared with the previous period
- your followers and the growth in this period
- a chart of engagement per day, week or month
- the figures per channel
- your ten best posts
- the best times to post
Your company logo is at the top. Set it under Settings → Company → Logo. Without a logo of your own, the Socialschedulr logo is shown.
Following competitors? Then the comparison is in the report too. Want the report emailed automatically every week or month, optionally without our name on it? Read Automatic reports.
Want to work with the numbers yourself? Click CSV for a file for Excel. Read Exporting analytics.
The report is in the language of the person who creates it: English or Dutch.
Still stuck? Email us at info@taptoconnect.nl. A real person reads it and helps you out.