 TapToConnect
Reading your analytics
What do reach, engagement and engagement rate mean?
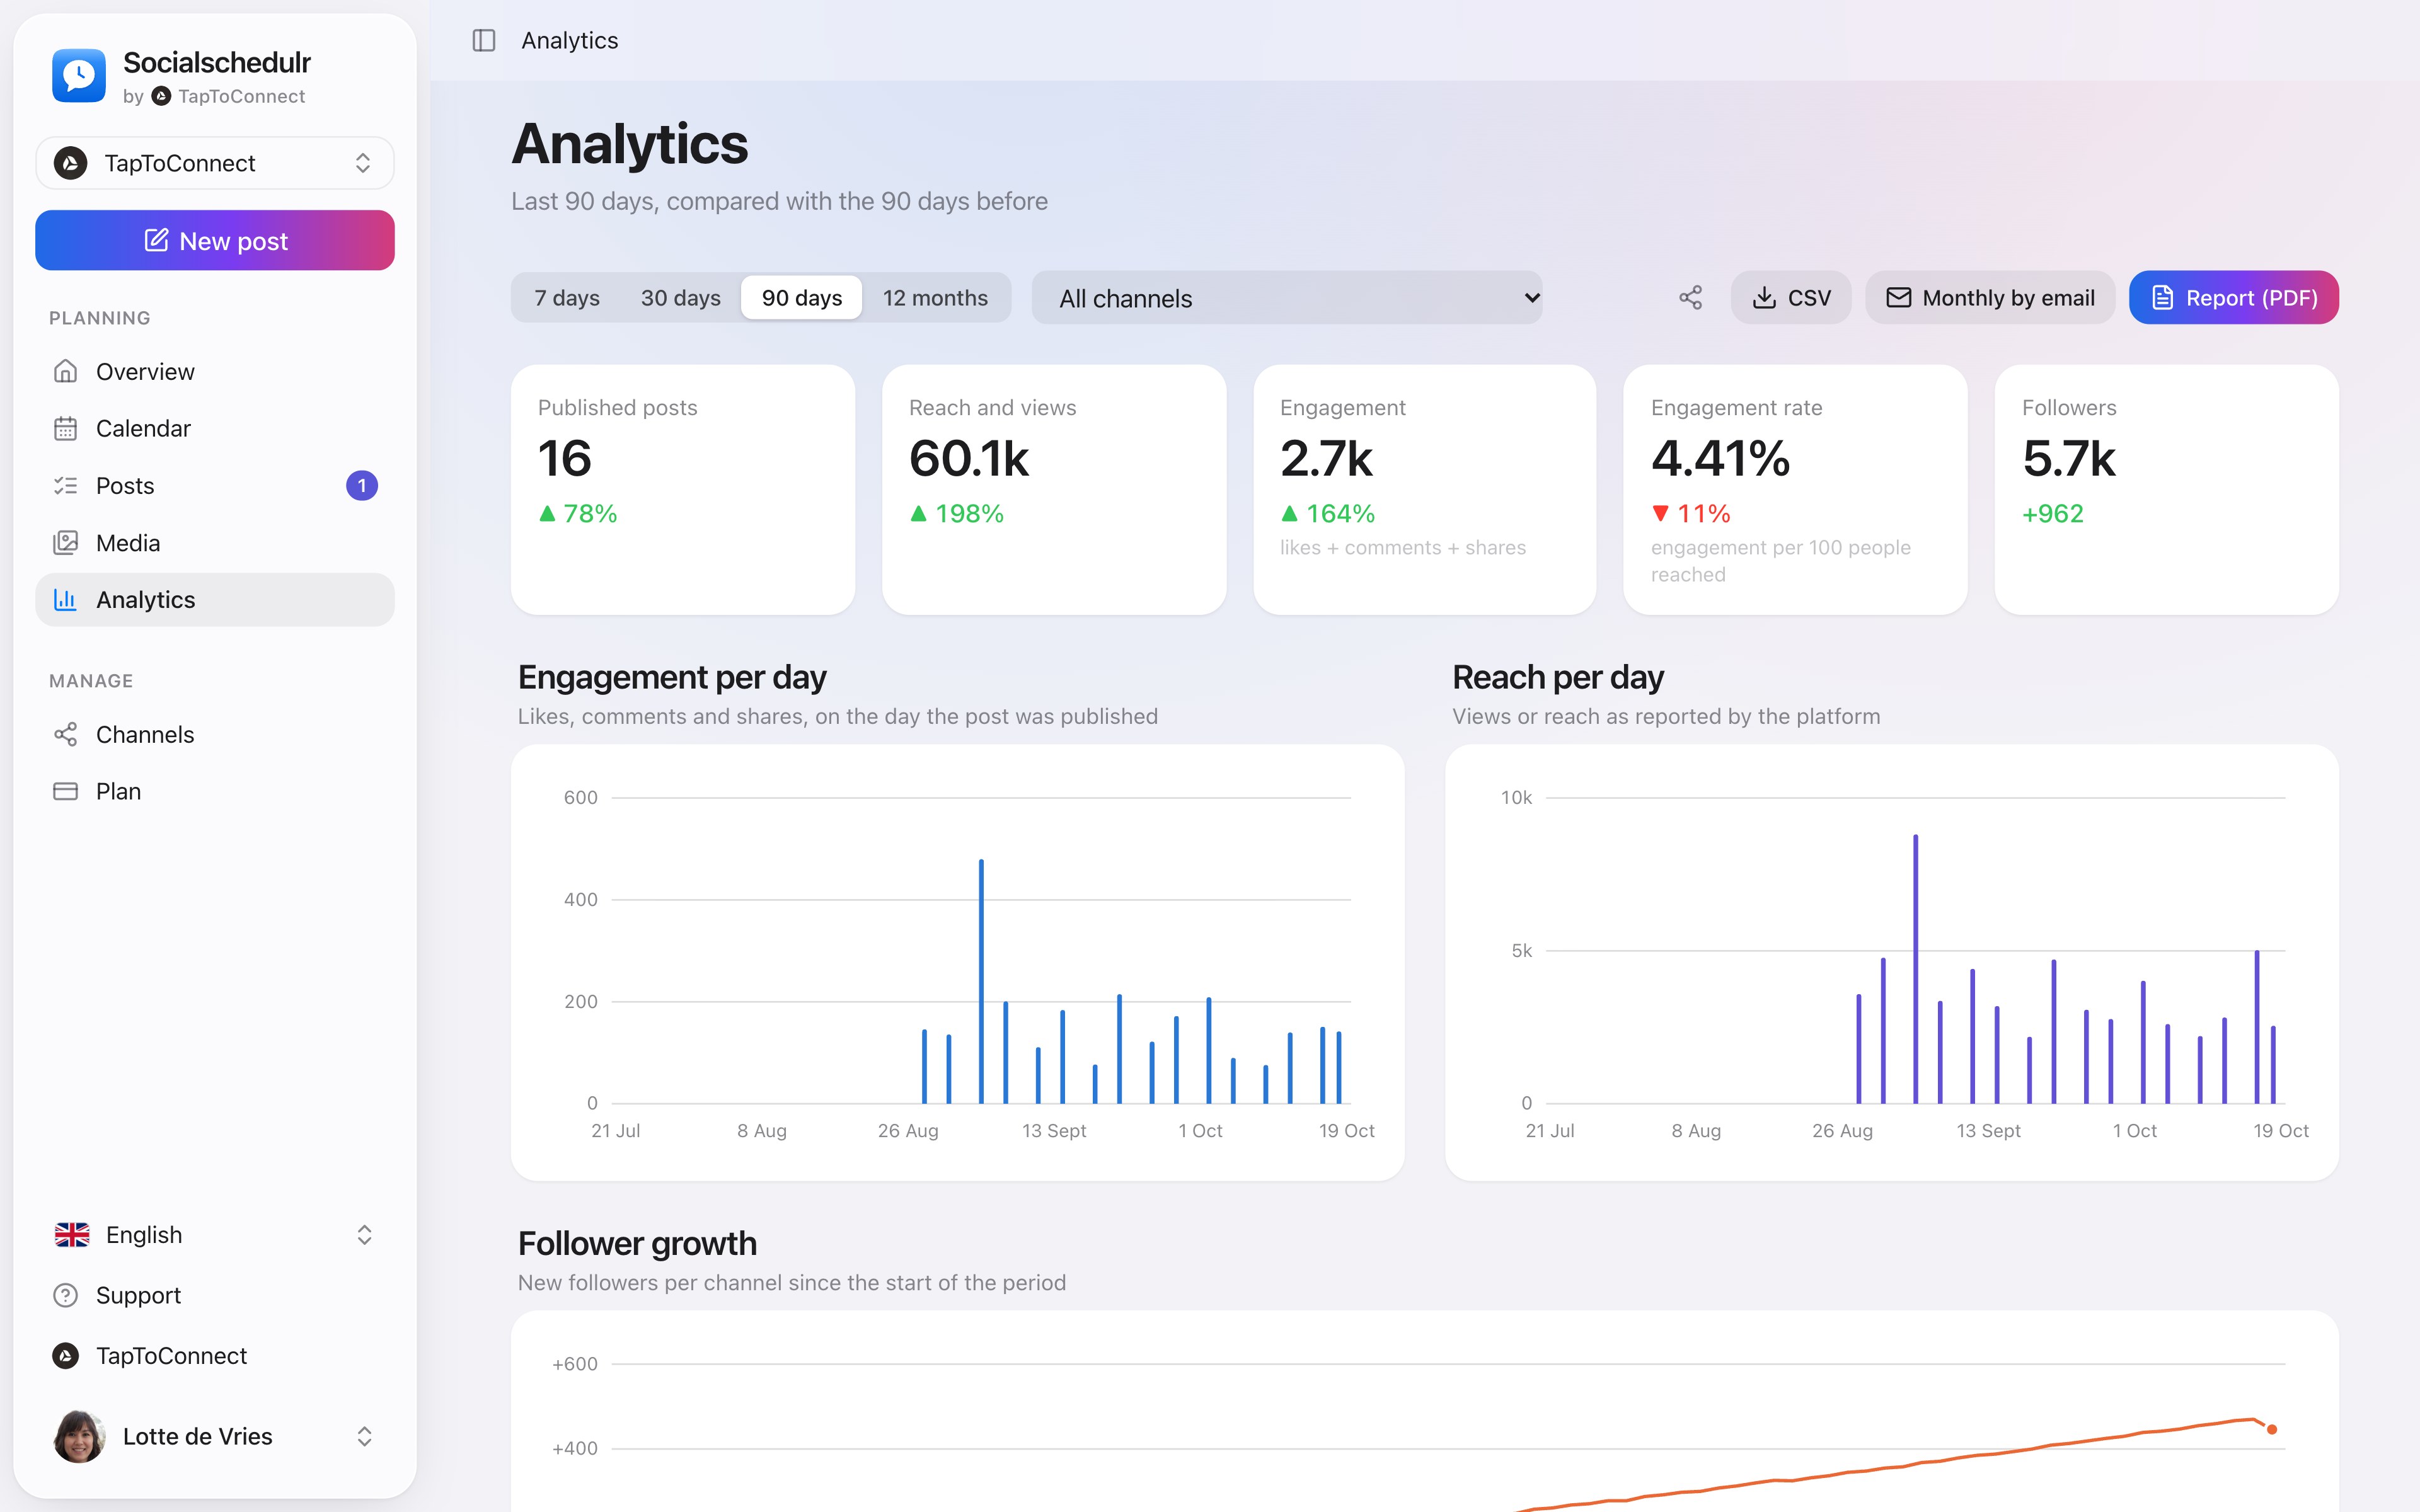
▶Watch the video: analyticsWith captionsUnder Analytics you see how your posts are doing. Choose a period at the top (7, 30 or 90 days or 12 months) and optionally one channel. All numbers are compared with the period before.
| Number | Meaning |
|---|---|
| Reach and views | How often your posts were seen, as reported by the platform |
| Engagement | Likes + comments + shares |
| Engagement rate | Engagement per 100 reach |
| Followers | The total number of followers of your channels, with the growth in the period |
Charts
- Engagement and reach per day: per day on which a post was published.
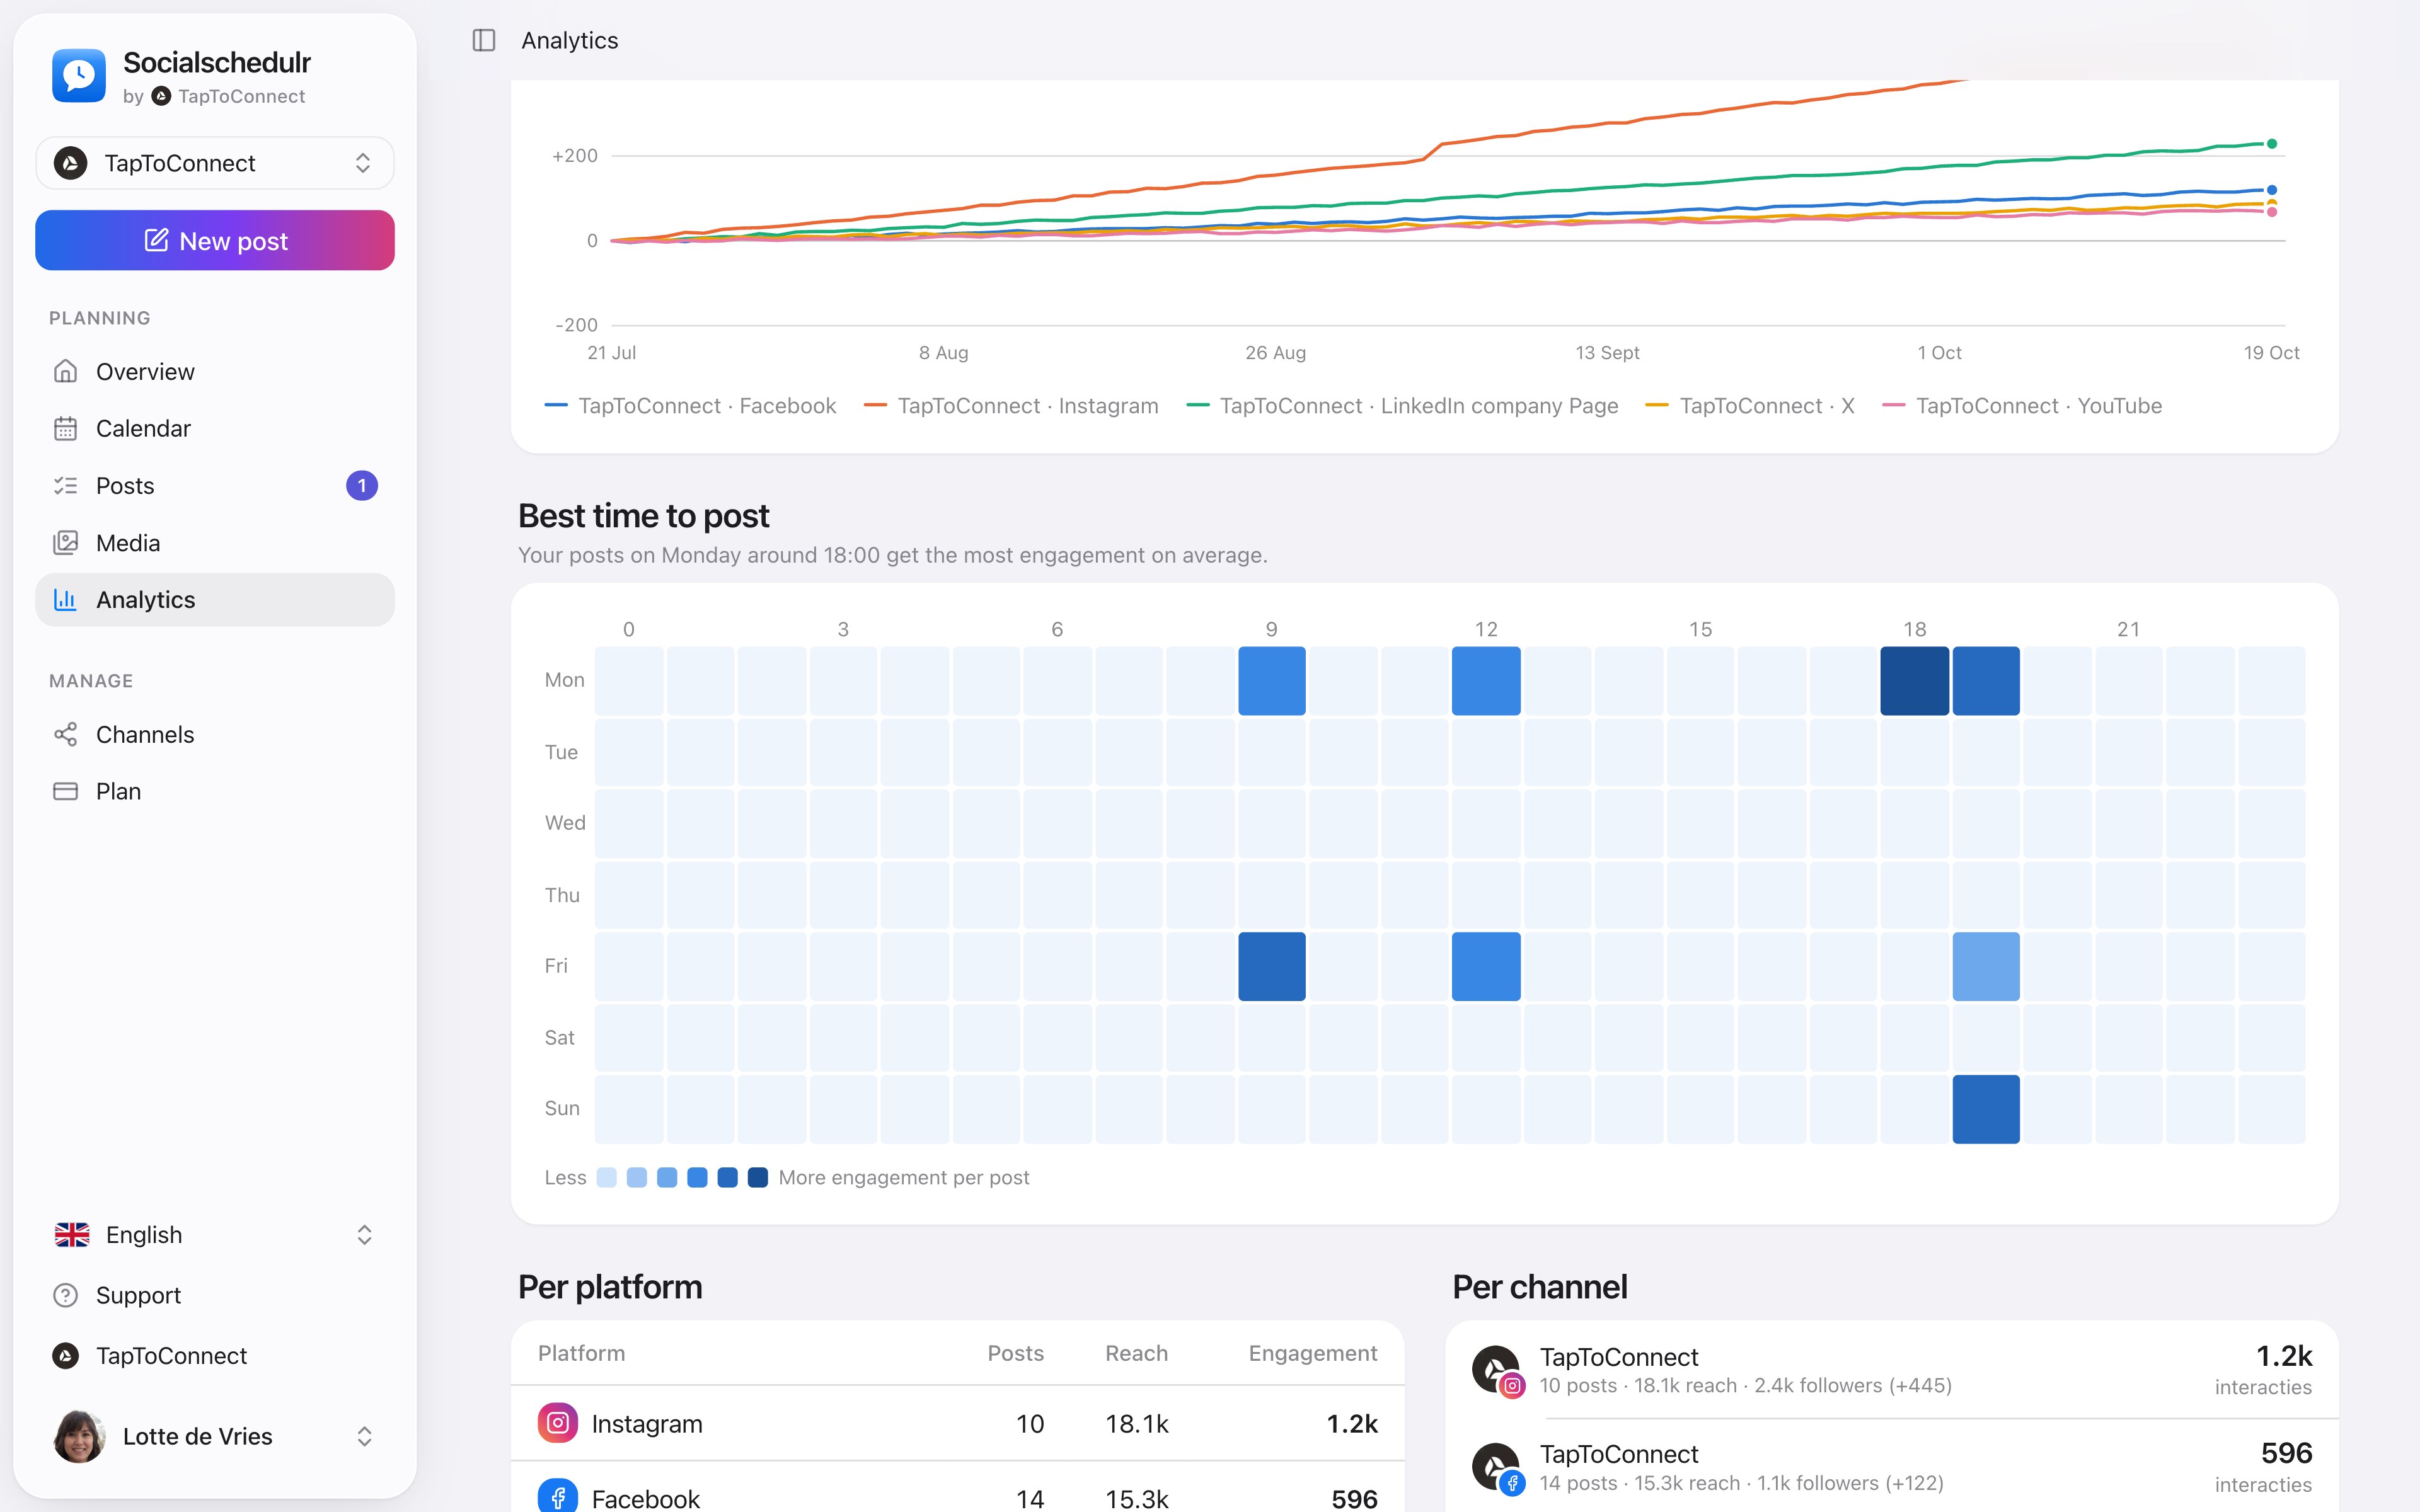
- Follower growth: how many followers each channel gained since the start of the period.
- Best time to post: an overview per day and hour. The darker the square, the more engagement your posts got on average at that moment.
At the bottom are all posts, sortable by engagement, reach, likes, comments or date.
Why don't I see numbers (yet)?
- Platforms share numbers with some delay. Socialschedulr fetches them every hour.
- Not every platform shares everything. A personal LinkedIn profile doesn't share reach, for example, and Facebook and Instagram only share reach if you gave permission for it.
- Followers are recorded every night from the moment you connect a channel. So the chart fills up by itself.
Still stuck? Email us at info@taptoconnect.nl. A real person reads it and helps you out.